<tea>
I’ve been a massive massive fan of PowerBI for some time now, and an even bigger fan of Power Query; so much so that here’s a shameless plug for a Power Query course I wrote year ago here. Moving forward it’s fair to say that every Project Online/Server implementation I now do has some portion of PowerBI/Excel reporting, underpinned by oData (Project Online) or SQL Queries (Project Server) feeding into PowerQuery to cleanse and transform the data. Additionally I’ll often merge other data (especially financial data) from Navision (via oData) or Oracle (via CSV files!) to provide a complete project overview.
RAG Statuses in PWA
One of the more common scenarios that we do in Project Online is to provide RAG statuses for different project status, for example Technical RAG, Financial RAG, Schedule RAG etc. These are represented as Enterprise Custom Fields supported by a lookup table, and matched up with Graphical Indicators give us a really nice overview in Project Web App.
RAG Statuses in PowerBI
Moving towards PowerBI, in reality it’s very easy to get the RAG stastuses in PowerBI. My fellow MVP Paul Mather does a great job explaining PowerBI and accessing Project Online data here and so I’m not going to focus on accessing the data, rather I’ll show you how you can create some great looking RAG status reports.
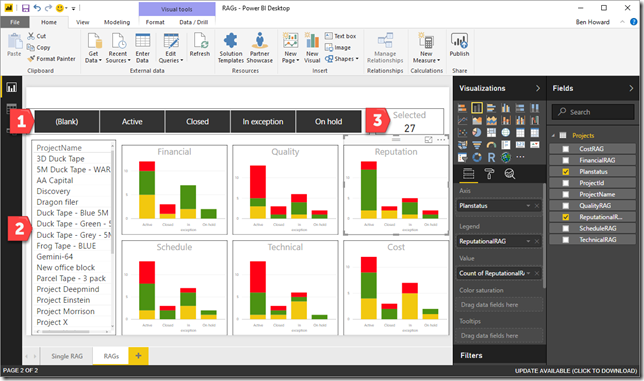
In PowerBI we just need to create a query that accesses the Projects table, and in my case I then remove the columns I’m not interested in and filter out the Timesheet Project. In this case I’m interested in ProjectID (because you never know when you’ll need this), the Project Name, the Plan Status (another ECF displaying whether the plan is “Active”, “On-hold” etc) and then all the RAGs (Quality, Cost etc). The relevant fields can be seen in the screen shot below…
…and for completeness here is the M-Code from the PowerQuery statement
let
Source = OData.Feed(URL),
Projects_table = Source{[Name=”Projects”,Signature=”table”]}[Data],
#”Removed Other Columns” = Table.SelectColumns(Projects_table,{“ProjectId”, “ProjectName”, “Planstatus”, “QualityRAG”, “CostRAG”, “ScheduleRAG”, “ReputationalRAG”, “TechnicalRAG”, “FinancialRAG”}),
#”Filtered Rows” = Table.SelectRows(#”Removed Other Columns”, each ([ProjectName] <> “Timesheet Administrative Work Items”))
in
#”Filtered Rows”
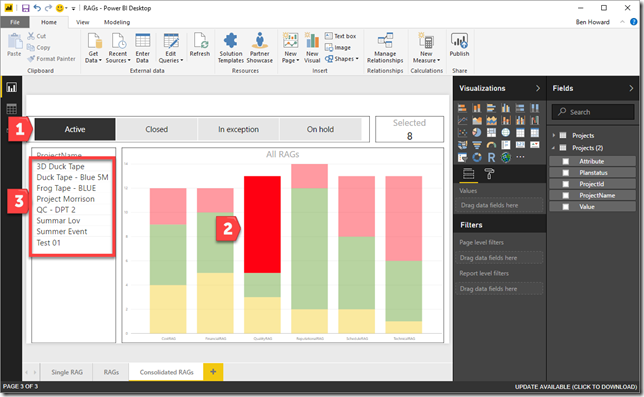
I can then easily create a PowerBI report where I show a stacked bar for each RAG; this is filtered by the “Status” buttons (1) and the projects that meet the criteria are displayed in the table visualisation (2). The card (3) displays the number of items selected. You can access this report here.
Though this is very demonstrable sometimes you’ll want to display all the RAGs in a single visualisation, rather than six separate visualisations as it is at the moment. In order to do this we need to go back into the Query Editor and Unpivot the RAG Columns.
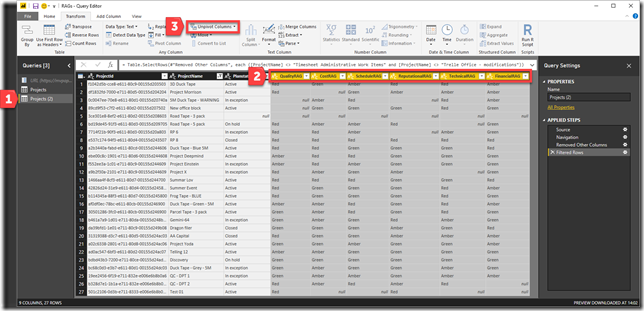
Before we unpivot the data, let’s have a look at the Query and the process so far…
- I’ve created a duplicate of the Query (Projects (2))
- I’ve highlighted the rows to unpivot
- I’ll then Unpivot the columns
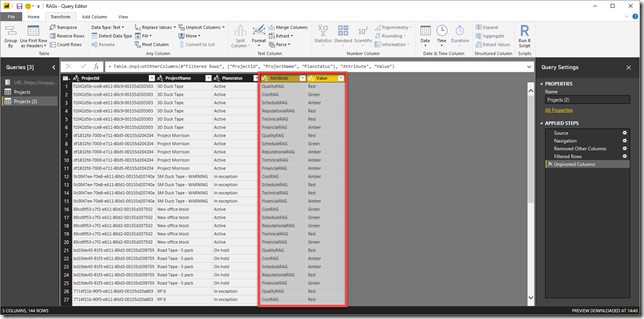
And here’s the result.
For those of you who are interested, here’s the M-Code
let
Source = OData.Feed(URL),
Projects_table = Source{[Name=”Projects”,Signature=”table”]}[Data],
#”Removed Other Columns” = Table.SelectColumns(Projects_table,{“ProjectId”, “ProjectName”, “Planstatus”, “QualityRAG”, “CostRAG”, “ScheduleRAG”, “ReputationalRAG”, “TechnicalRAG”, “FinancialRAG”}),
#”Filtered Rows” = Table.SelectRows(#”Removed Other Columns”, each ([ProjectName] <> “Timesheet Administrative Work Items”)),
#”Unpivoted Columns” = Table.UnpivotOtherColumns(#”Filtered Rows”, {“ProjectId”, “ProjectName”, “Planstatus”}, “Attribute”, “Value”)
in
#”Unpivoted Columns”
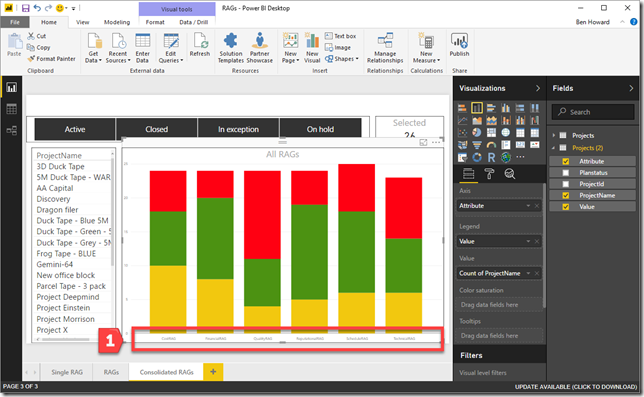
We can then create a stacked bar where we have the RAG type (cost, schedule etc) as the axis (1).
A few clicks later (easy as 1,2,3) and we can see those projects that have their Quality RAG set as RED. You can access this report here (you might need to scroll between the pages).
Have fun…
Ben.


