This is a nice little trick, that I’ve used several times at client site to slow both optimistic and/or pessimistic durations on a single gantt chart. This really is a great view to help senior management understand what might happen on a project, and we can show the cumulative effect of both bringing tasks in early and/or late. It’s a great view to get resources 🙂
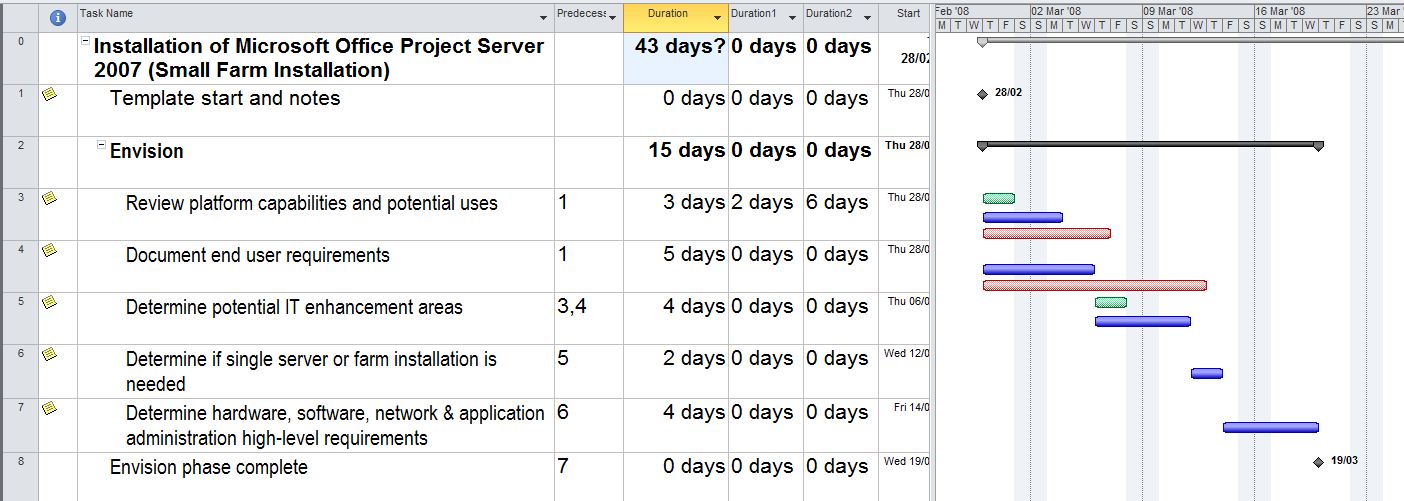
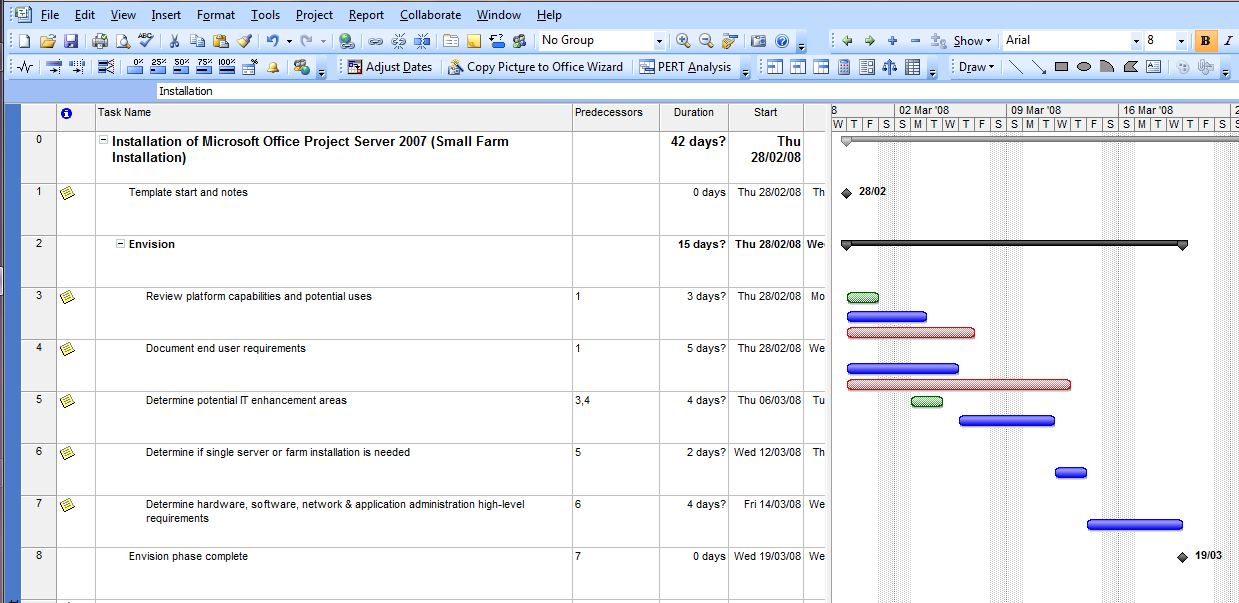
The end result looks something like the gantt chart below, where the green duration shows displays an optimistic duration, the blue the expected, and the red the pessimistic duration. It’s also possible for tasks to have one, both or none of the optimistic or pessimistic durations (as tasks 4 and 5 display below, with one each, and tasks 6 and 7 having neither).
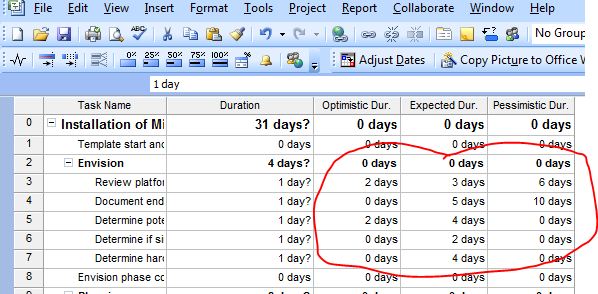
Note that this technique relies on PERT analysis, which has been removed from Project 2010. You can still set this up manually in Project 2010 (see screen shot below), and if you want to implement PERT then check out this blog – http://blogs.technet.com/b/projectified/archive/2009/11/24/3296207.aspx
Step 1 – Add the PERT Analysis toolbar to Project
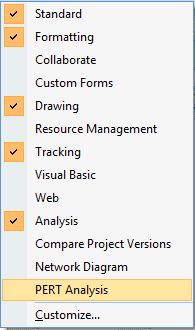
Within Project 2007, right click on the toolbar and select PERT Analysis.
Once this is done, you’ll notice another toolbar ![]() – this is the PERT toolbar. Hover over each of the icons in turn to display the actions.
– this is the PERT toolbar. Hover over each of the icons in turn to display the actions.
Step 2 – Set the PERT weights
Before we set anything, be aware that PERT is traditionally used to calculate and display an optimistic, expected and pessimistic duration. We are going to change the weights to leave the expected duration alone.
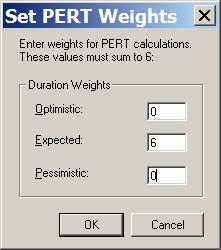
Click on the balance icon to set the PERT weights. The Optimistic and Pessimistic must be set to Zero, and the Expected to 6. This is a per project setting and therefore must be completed for EACH project.
Step 3 – Use the PERT Entry Sheet to set the Optimistic, Expected and Pessimistic durations
The PERT Entry Sheet is used to enter the Optimistic, Expected and Pessimistic durations. Note that if you have already set the durations for the tasks, then you need to make sure that the expected duration is equal to the duration you have previously set.
Step 4 – Use the calculate button set the start and finish dates for the tasks
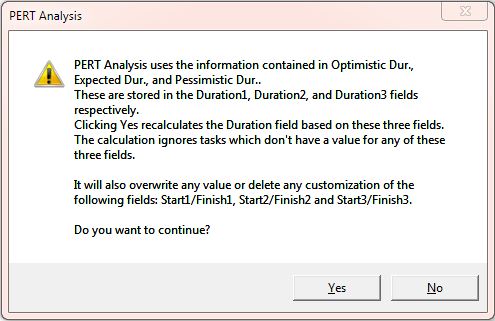
The calculate button needs to be used in order to set the start and finish dates for the optimistic and pessimistic durations. When you click the button, the following message appears.
Step 5 – Display the Optimistic and Pessimistic durations
Now that the relevant start/finish and durations are calculated, it’s time to start displaying these on the Gantt chart.
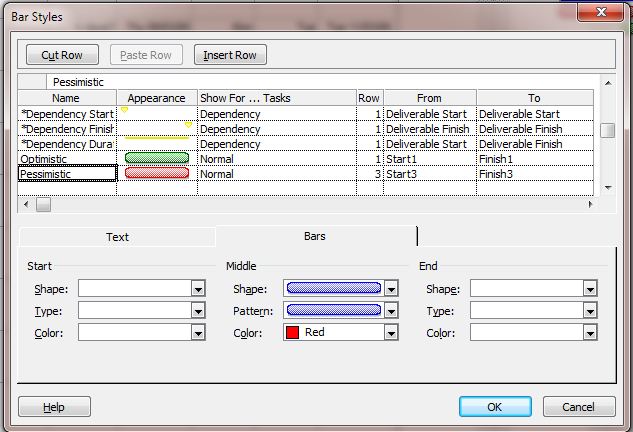
Within project, select the Gantt chart view and then Format | Bar Styles.
There are several things you need to change within the Bar Styles window.
1. Set up a new row, called Optimistic, with a bar colour of green, showing for Normal tasks, row 1, from Start1 to Finish1.
2. Set up a new row, called Pessimistic, with a bar colour of red, showing for Normal tasks, row 3, from Start3 to Finish3.
3. Find the row named Task, (this is the display for “normal, standard” tasks, and change the row value from 1 to 2.
4. If you have any rows that are set to display critical tasks with a (default) red bar, then these should be deleted as red is being used to show the pessimistic durations.
The view will now display the optimistic, pessimistic and expected durations on the Gantt chart on the rows specified within the bar styles above (this time in Project 2007).
enjoy – Ben.
