17 Dec Best Practices for Integration of Microsoft Project and Excel
Introduction
This article discusses Project and Excel integration points, specifically in the following areas:
- How to import data from Excel to Project
- Importing an initial last list
- How to export data from Project to Excel
- Exporting a to-do list for resources
- Exporting time-phased data for reporting
Why Bother with Excel?
First things first! My view is that Excel has become the default application used in most offices for producing lists, tabular data (i.e. lists with more than a single column), and graphs derived from the data. Excel has both advantages and disadvantages over Project, and there’s a definite tipping point between using Excel and using Project
Speaking of tabular data, let’s review a small set of the pros and cons for using Excel and Project when managing a Gantt chart.
We’ll look at the pros first:
| Excel | Project |
| Easy to change column widths and colour columns, therefore easy to create a Gannt chart | Standard Office interface |
| Very simple to get started | Built from the ground up as a Critical Path Analysis tool |
| Great for producing a list of tasks | The largest market share by revenue and volume of all the project management tools |
| Easy to share | Longevity and maturity since the mid 1980’s |
| Dependent tasks are dynamically moved when a predecessor task is moved or delayed (dynamic schedules) | |
| Resource assignments and cost roll-ups | |
| Extensible and configurable |
And now, the cons:
| Excel | Project |
| No ability to properly resource load a project | It’s easy to start using Project, but the sheer number of features can soon overwhelm users |
| No ability to auto-calculate costs | Historically seen as only suitable for managing waterfall types projects |
| Difficult to change and update | Not easy to share plans beyond the Project Management community |
| No ability to track the current plan vs the baseline | Updating anything other than a simple schedule requires a higher degree of sophistication |
| Requirement to update all subsequent task dates when a predecessor task moves or is delayed. |
As you can see from my personal tables of pros and cons, Excel works well when we’re dealing with little more than a bunch of tasks and where we might want to draw a representation of a Gantt chart, but the point at which we’ll want to start using Project starts when we want to introduce any of the following:
1. Dynamic Scheduling
2. Resources
3. Costs
4. Critical Path
5. Tracking
6. Forecasting the future
7. Reporting
When users need to get into any of the above, it’s a good idea to start using Project, so let’s think about how to import the data.
Import an Existing Excel file into Project
Copy and Paste
There are a couple of ways to import Excel data into Project, so let’s start with the easiest, which, of course, is copy and paste. In order to start this off, I’ve been using an Excel template call Project Planner, which matches my current needs of recording activities and durations. Note that one of the issues with this type of Excel file is the lack of fidelity in the durations. I’m limited to weeks in the Project Planner template.
Figure 1 – The Project Planner Excel template
To import the tasks, I can perform a simple copy and paste of the activity name from Excel to the Task Name in Project.
Figure 2 – Tasks pasted with Manually Scheduled as the default task mode
As you can see, the paste has created new tasks, but because the Task Scheduling mode for new tasks is set to Manually Scheduled, the tasks are created without any duration, start, or finish dates.
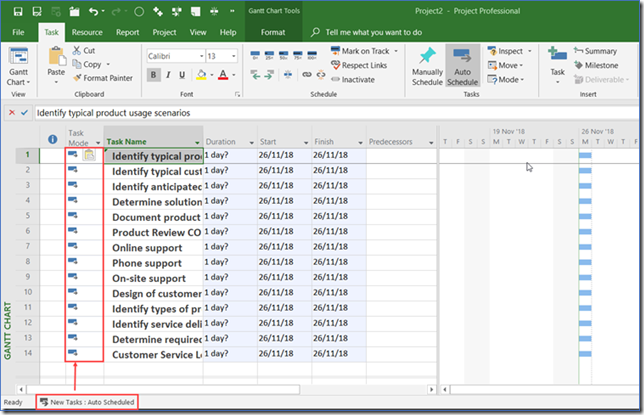
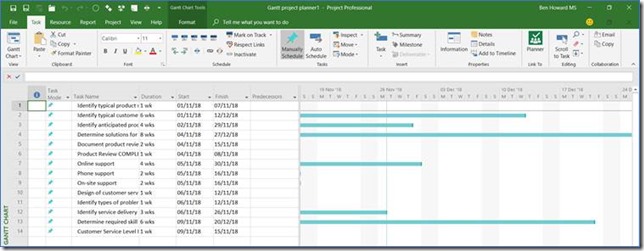
If I do that again, but with the Task Scheduling mode for new tasks set to Auto Scheduled, you will see that durations, start, and finish dates are created and Gantt bars can be displayed for each task.
Figure 3 – Tasks pasted with Auto Scheduled as the default task mode
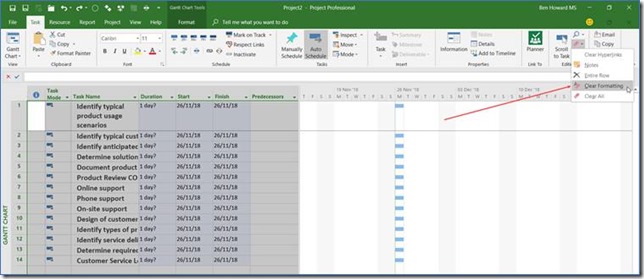
Note that any formatting applied to the text in Excel is preserved during the paste. If I wanted to reset the formatting back to default, I could either immediately use the smart tag and select Match Destination Formatting or use the Clear Formatting button from the ribbon.
Figure 4 – Using the Smart Tag to select the formatting
Figure 5 – The Clear Formatting button on the ribbon
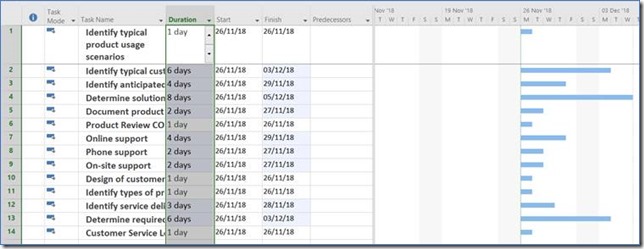
The next thing we can do is import the duration. After all, it is a field in the Excel file. The issue here is that the default duration value is set to “days,” and therefore when we import the duration value, it is expressed in days. As previously stated, the Excel file has the duration in weeks.
Figure 6 – Durations pasted in by default in “days”
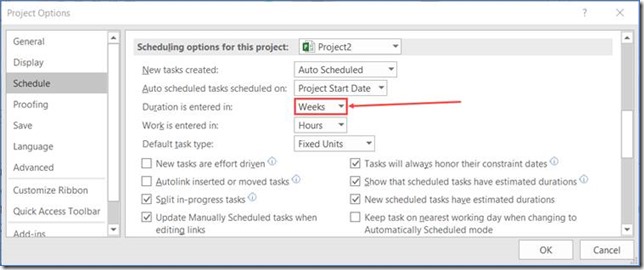
Using the Project | Options dialogue box, we can change the default duration to weeks and then re-paste the data. Note that you may have to reset the durations back to “1day ?” prior to re-pasting.
Figure 7 – Set the Duration to be entered in Weeks
Figure 8 – Imported data with correct duration values of weeks
Creating a New Plan by Using the Import Wizard
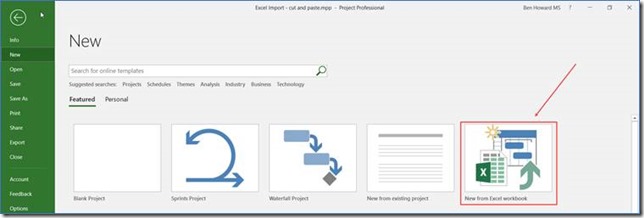
We also have the option of importing an existing Excel workbook.
Figure 9 – New from Excel workbook
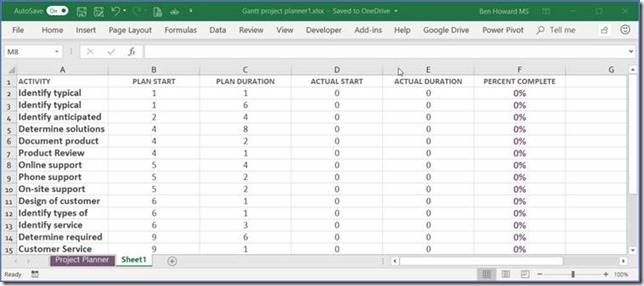
Before you import an Excel workbook, you need to do a little work on it because the Excel import expects a simple list with optional headers. It doesn’t really handle blank lines or merged cells very well, or at all. To get around this, you should copy and paste the relevant items into a new sheet.
Figure 10 – Cleansed Excel file ready for import into Project
Now you’re ready to import the Excel file.
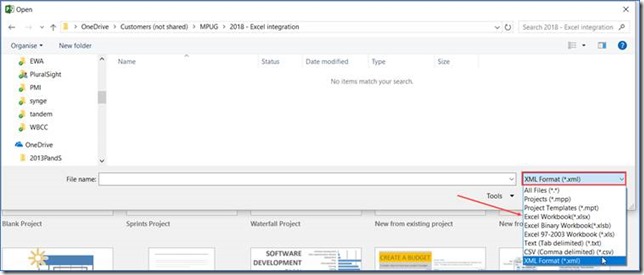
Figure 11 – Change the file type from .xml to .xlsx
Remember to change the file type from .xml to .xlsx in the file open dialogue box.
Figure 12 – Select your Excel file
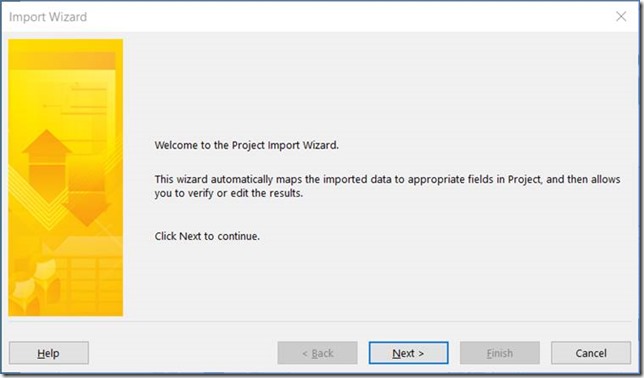
You’ll be presented with a wizard, and it’s really just a question of walking though the various screens, as shown below.
Figure 13 – Click Next to start the import wizard
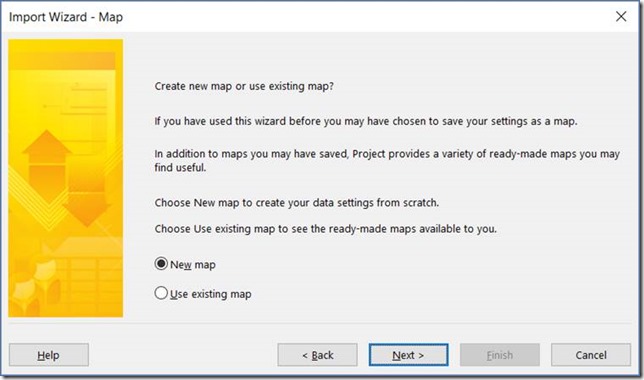
Figure 14 – Choose New map
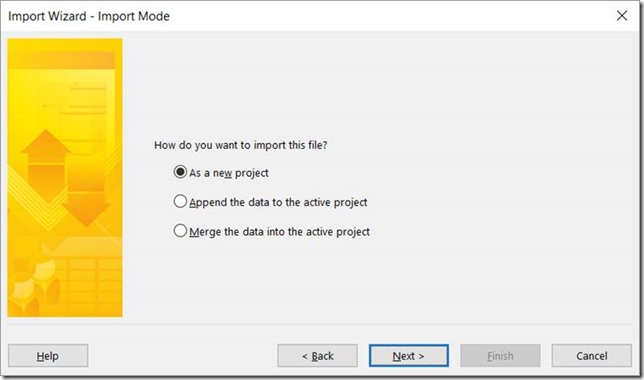
Choose whether to append to an existing project or create a new one.
Figure 15 – Choose As a new project
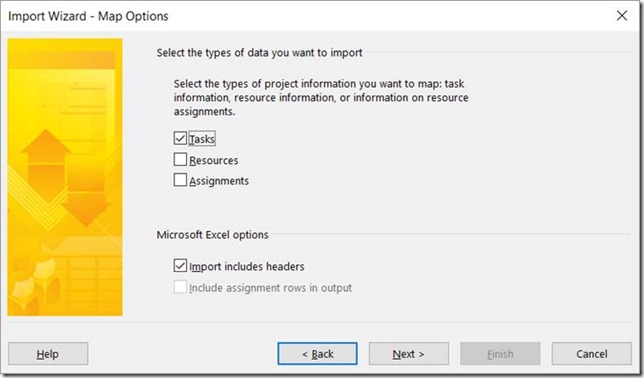
Then, choose what to import. The Excel file only contains tasks, and each column has a header, so you’ll need to select both items.
Figure 16 – Tasks and headers are selected
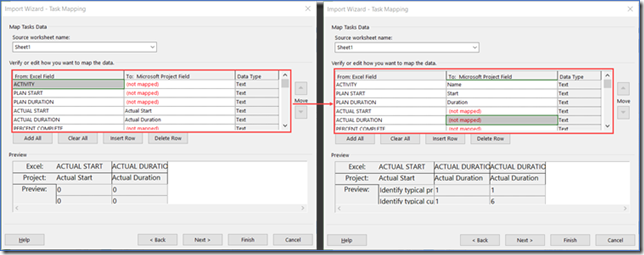
The next screen is where the mapping of Excel fields to Project fields happens.
Select the drop down list to choose the fields to. Fields are mapped automatically if the names are the same between Excel and Project. Note I have chosen not to bring in the Actual Start, Duration values, or Percent Complete.
Figure 17 – Map fields as necessary
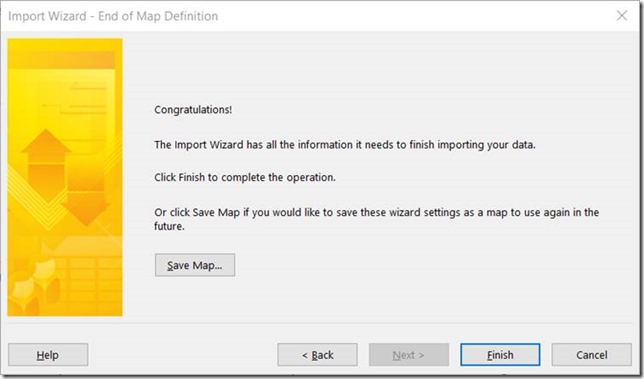
If this process is going to be repeated, then it is worth saving the fields in a new map.
Figure 18 – Save a map if required
The mapped fields are imported into Project, using the default settings. Remember that the duration had already been set to weeks, and in this instance, because both the start and duration fields were mapped, Project could work out the finish date.
Figure 19 – Finish date has been calculated
Finessing the Schedule
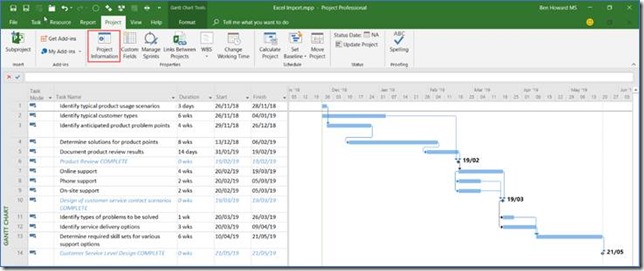
Now that the data is in Project we can begin to finesse it, change the task types, enter or modify start dates, or even better, create dependencies between the tasks (there is no way to easily convert the week number that the activity starts in the Excel file to a relative week number in the Project plan because Project works with real dates).
We’re going to finesse the schedule somewhat, changing the durations to better reflect reality, and adding in dependences and constraints where necessary.
Figure 20 – Project Gantt chart
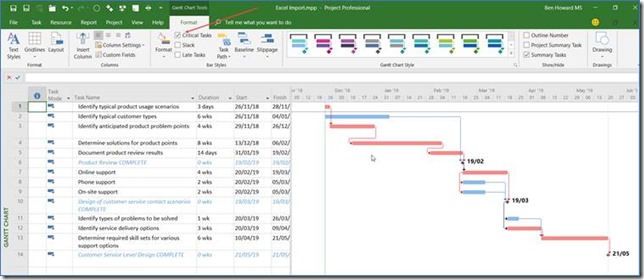
We can now easily visualize the different phases of the schedule, the milestones, and the interdependencies between tasks. Project even tells us when we’re due to finish (remember you can set the start date of the project via the Project tab, the Project Information button, or simply set the start date of the first two tasks). Already this Gantt chart is easier to read than its Excel equivalent, and it gets even better, as a quick selection of the checkbox to show critical tasks displays the critical path. That is, those tasks whose duration should not be delayed if I want to deliver the project in the shortest possible time.
Figure 21 – Critical tasks
For those of us who have worked with Project for some time, this is not a revelation, but I have worked with customers who have experienced a “eureka” moment at seeing this.
We’re going to add some resources as assignments to the schedule.
Figure 22 – Resources added
Exporting Project Data to Excel
We’ve covered moving Excel data into Project, but it’s often useful to export Project data into Excel, especially from a communications and reporting perspective. In this example, we will produce a “who does what when” report, which used to be in Project, but was deprecated in the 2010 release.
Copy and Paste
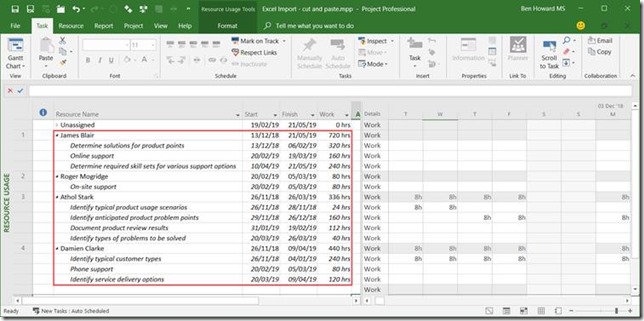
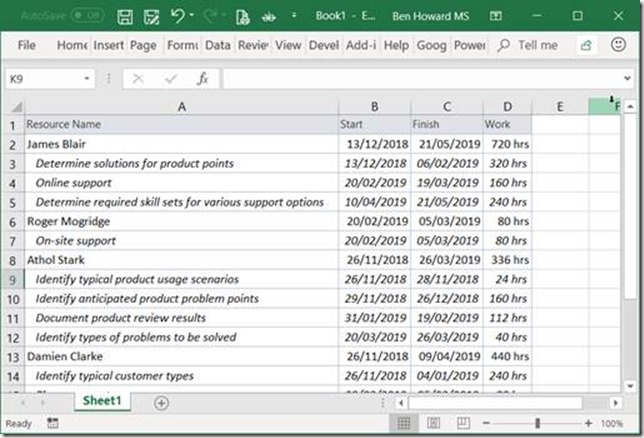
The simplest way to get at this data into Excel is to use the Resource Usage view, add in both the start and finish columns, highlight the data, and copy and paste it into Excel.
Figure 23 – Highlight the data to be copied to Excel
Figure 24 – The Resources and their tasks pasted into Excel
Visual Reports
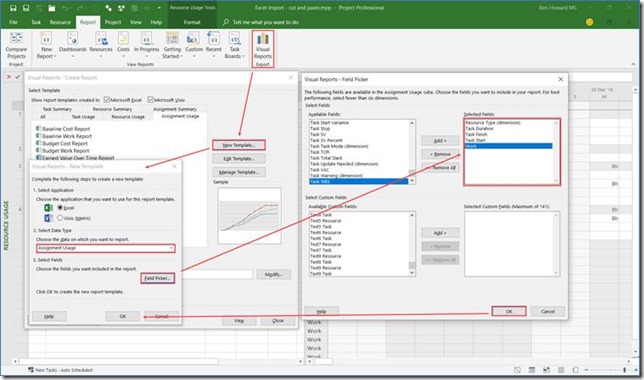
A more sophisticated and repeatable way to export data is to use the Visual Reports feature, which can export data to either Excel or Visio. There are many built in templates, but you can also build your own.
Using the New Template button, select the following fields:
· Resource Type
· Task Duration
· Task Finish
· Tasks Start
· Work
Figure 25 – Create a new Template
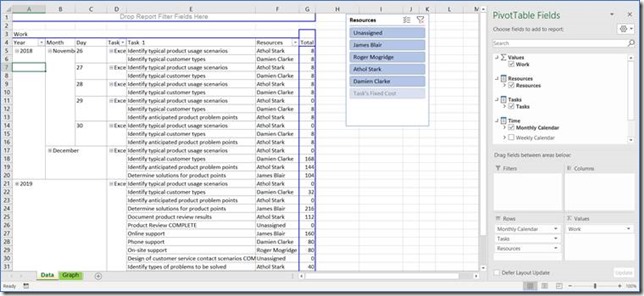
Project exports the data to Excel, and as long as you know about Pivot Tables, it’s easy to create your own reports and charts. Information on how to use Pivot Tables can be found in Excel’s help files.
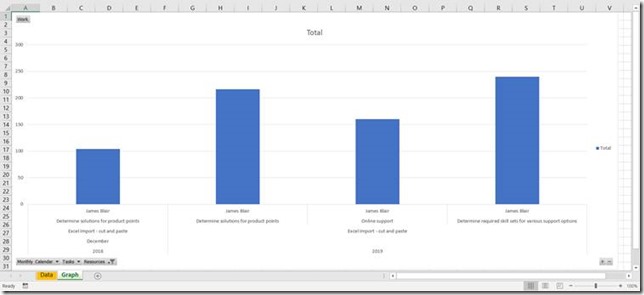
Figure 26 – Who Does What and When in Excel
Figure 27 – Graphical image of who does what and when
Save as Excel file
Saving as an Excel file brings up the Export wizard, which is very similar to the Import Wizard in functionality. The following options are available:
| Export what? | Comment |
| Tasks | A single line per task (great if you have only one resource assigned to each task though the option to “Include assignment rows in output” adds an additional line per task for each assignment) |
| Resources | Produces a list of resources on the project |
| Assignments | A single line per assignment (great if you have multiple assignments per task) |
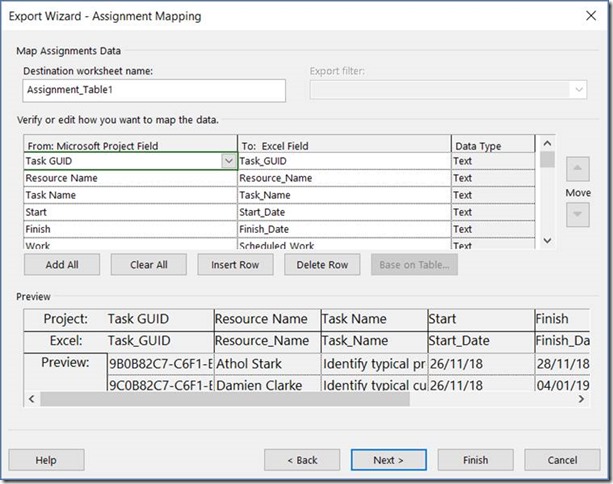
For a “who does what when report,” select Assignments during the mapping process and choose the fields to export. Note that the Task GUID is included in this report, but isn’t necessary.
Figure 28 – Select the Assignment fields to export
Each set of exported data (tasks, resources, and assignments) is placed in its own table in Excel, which can then be modified and handed out to resources, as required. A simple modification is to sort the data by Start Date.
Figure 29 – Assignment data in Excel
Summary
In this article I’ve discussed importing data from Excel to Project (typically done when users reach a limitation with Excel in terms of managing a Gantt Chart). Importing can be as simple as copy and paste or more sophisticatedly by using the Import Wizard.
It is also possible to take data the other way, from Project to Excel. Sometimes this can be as simple as a copy and paste, but we can also be a little more sophisticated by using Visual Reports or the Export to Excel wizard. All three methods produce great results, and you should experiment with each one and settle on using the one, which works best for you and meets your organization’s requirements.
If you want to check out the plan that I used to create the article and the other associated files they are available for download here.
Good luck!


