
23 Oct Displaying the current plan and multiple baselines
Keeping track of the current plan and a couple of baselines!
<Wasser>
Project has the ability to hold 11 baselines, and I’m often asked to devise a process whereby my client can track the current plan, the original plan, and any approved changes (design changes and the like).
So, here’s the theory and the process.
- Once the project has been scheduled, and prior to execution, the project is baselined placing baselines into two fields, Baseline Zero and Baseline 1.
- The project runs as planned and variances are tracked against Baseline Zero.
- Any approved changes are added to the plan, and Baseline Zero is updated with these approved changes.
- The project continues to run, and variances are tracked against Baseline Zero.
- At any time, it’s possible to produce a Gantt Chart displaying the current plan, Baseline Zero and Baseline 1, thereby showing the schedule, the current approved schedule (Baseline Zero) and the original approved schedule (Baseline 1).
Let’s go right ahead and walk through setting this up. If you want to see the video of it then click here.
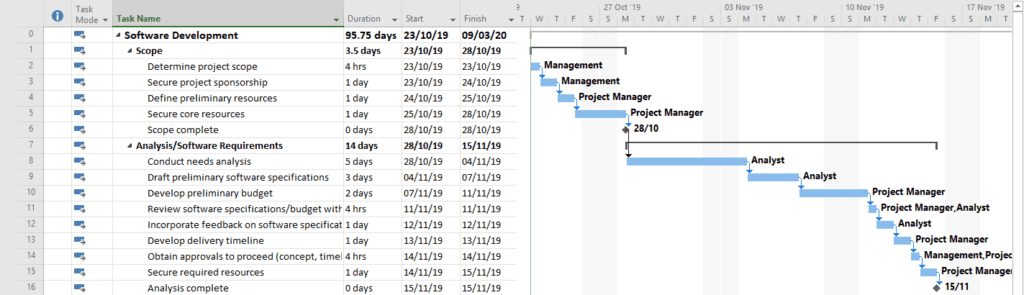
Below is a basic Gantt Chart, and we’ll use this as we walk through this blog.
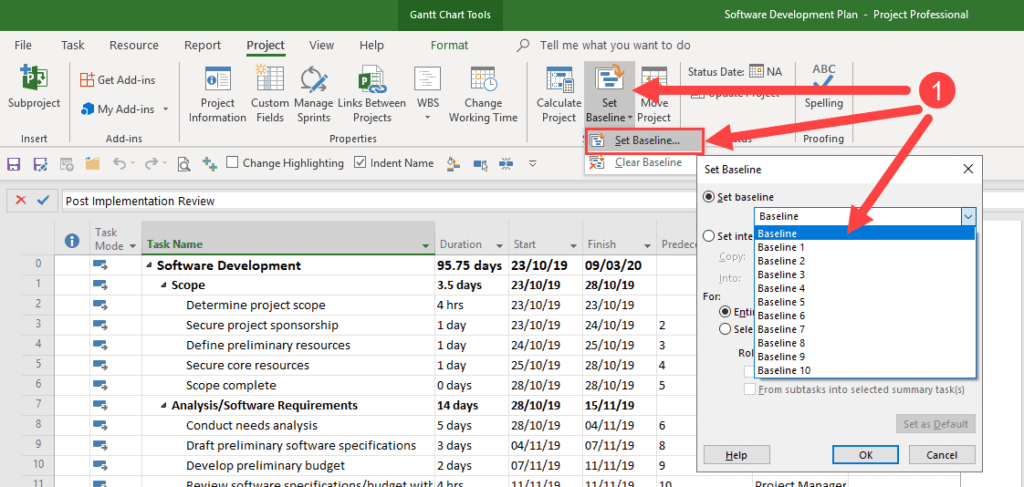
- To set up the baselines, select Set Baseline from the Project Tab. At this point you can just set the baseline for Baseline Zero (aka Baseline) and Baseline One (aka Baseline1).
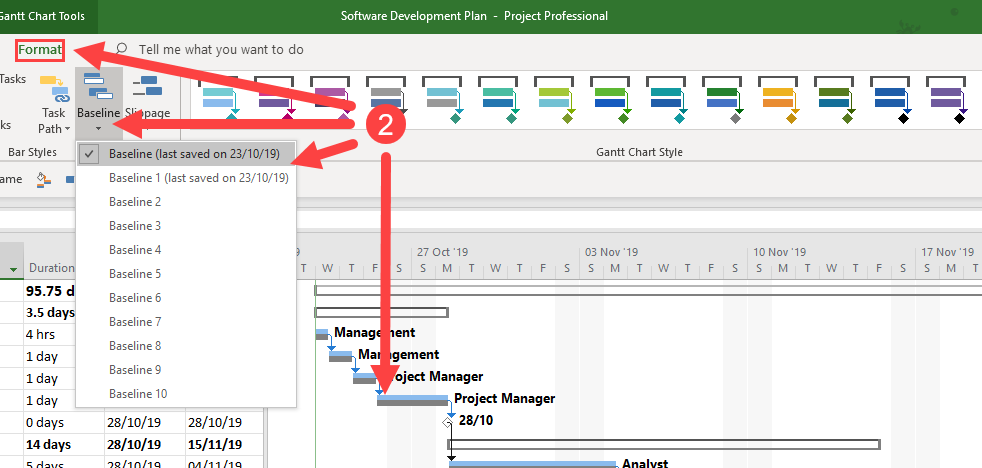
- To check that you’ve got both baselines saved, select the Format tab, and from the Baseline button choose which baseline to display. You’ll notice that the date you last updated the baseline is displayed next to the baseline name. It is not possible to rename the baseline in anyway; what I typically do is use the notes field against the project summary task to enter a note detailing when the baseline was taken.
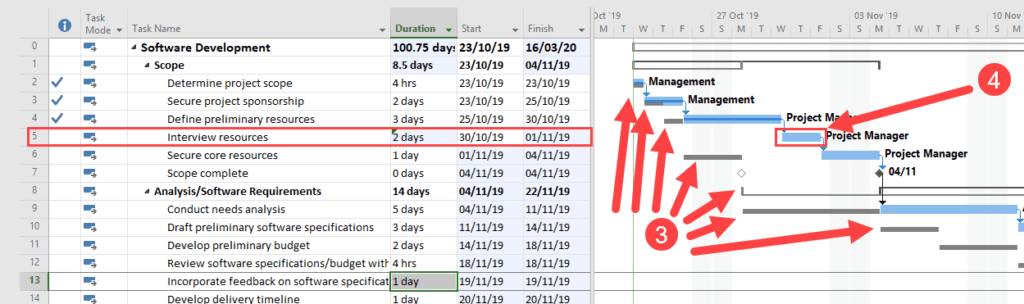
- Let’s make some changes to the plan. Here the existing baselines are visible (3) as is the new task (4).
- Notice that the new task does not have a baseline, of course why would it, it was created after the baselines were taken. Also notice how the insertion of the new task has moved the subsequent tasks because of the relationships, but that the baseline remains as a marker of where the original task was. This is why baselines are so useful for tracking variances and delays.
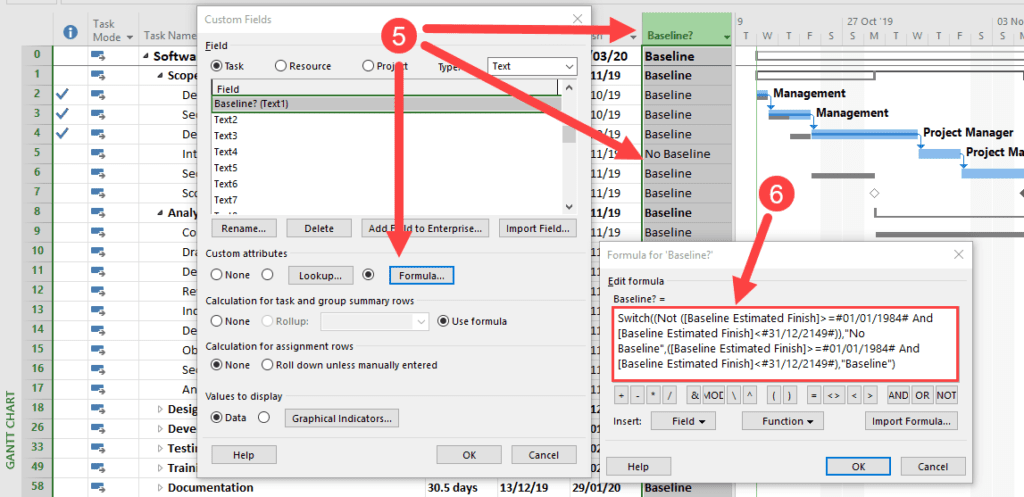
- What now needs to happen, is we need to identify which tasks don’t have a baseline (remember you might have many design changes) and many impacts thereof. I’m going to use a formula to easily identify which tasks haven’t been baselined, and I’ll use the custom field Text 1 to hold the formula. The formula basically tests for valid values in the Baseline field, and returns the text value of Baseline or No Baseline. Note that using this formula is optional for this blog.
- Switch((Not ([Baseline Estimated Finish]>=#01/01/1984# And [Baseline Estimated Finish]<#31/12/2149#)),”No Baseline”,([Baseline Estimated Finish]>=#01/01/1984# And [Baseline Estimated Finish]<#31/12/2149#),”Baseline”)
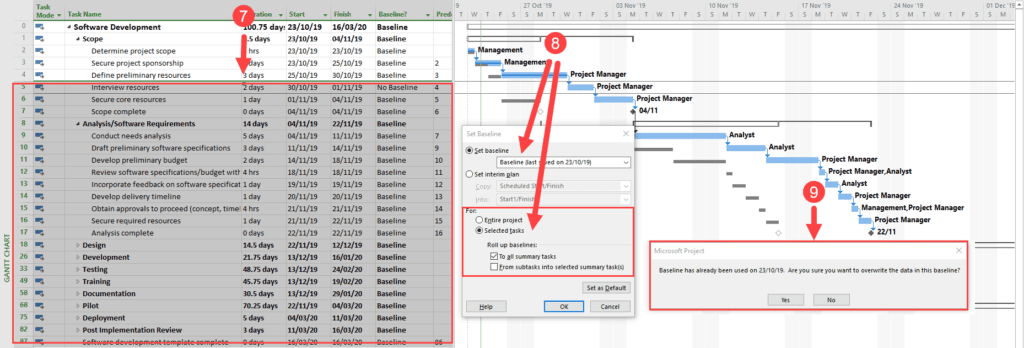
- So in this instance I’m going to highlight tasks IDs 5 onwards, as I want to re-baseline all of those tasks.
- Once they are all highlighted I can choose to update Baseline Zero. The important option here is only to update the baseline for the Selected tasks, and I also choose to update the summary tasks too.
- A warning is presented saying that you are overwriting some data and confirming if you want to do this. The answer is of course Yes.
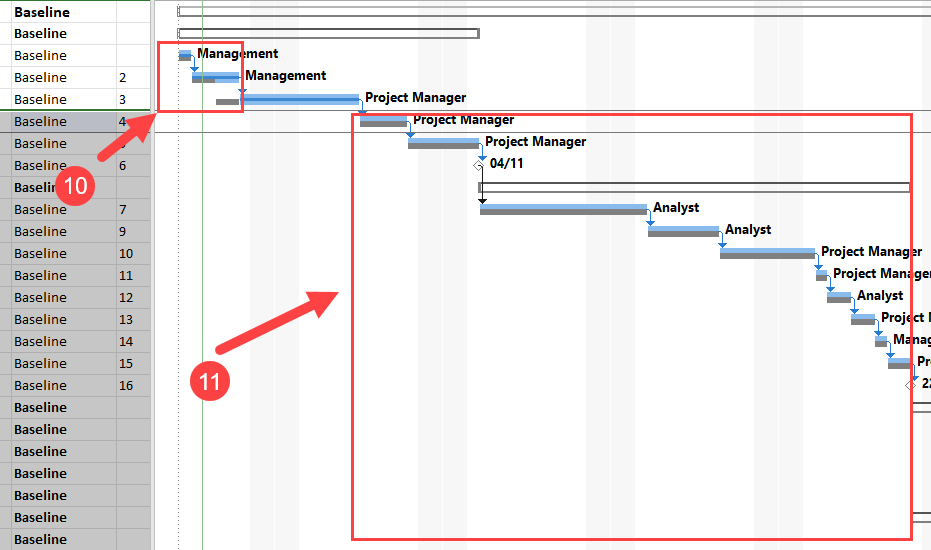
- The baseline is not updated for the tasks that we chose to update
- And of course it is updated for those tasks that were selected.
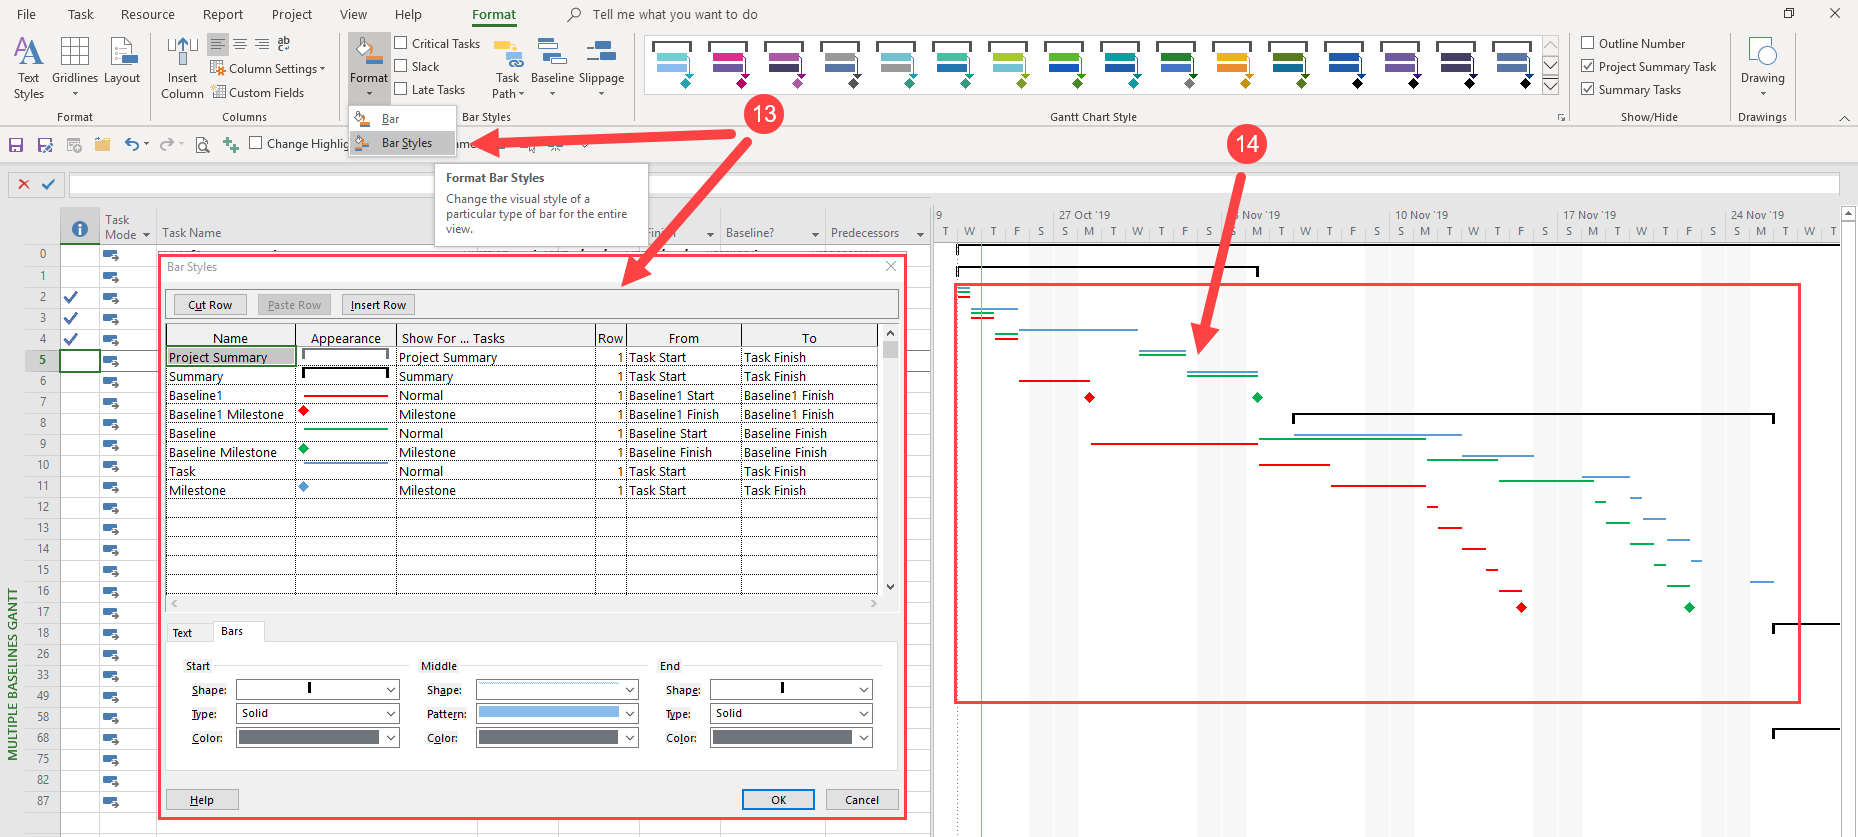
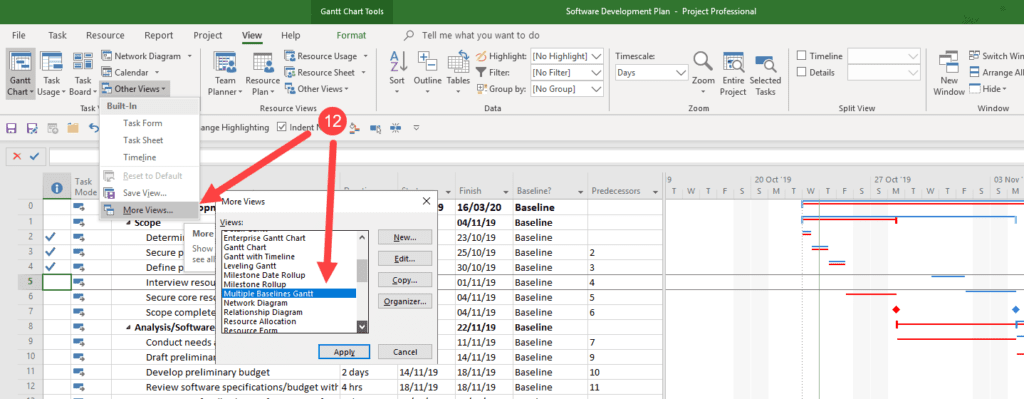
- Now the trick is to display the current plan, the original plan (baseline 1) and the current approved plan (baseline 0) on the Gantt Chart. For this we can use the “Multiple Baseline Gantt” selected from the Other Views | More Views button on the View tab.
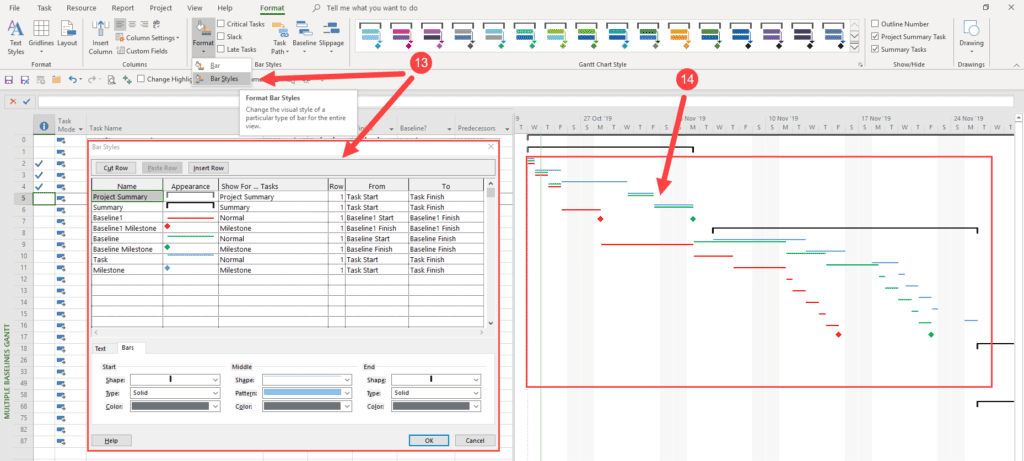
- So now the Gantt Chart actually displays baseline 0, 1 and 2. We need to modify this to display the current tasks, baseline 0 and then baseline 1. Use the format Bar Styles dialogue box to set this up. You will need to remove some of the existing lines and add in lines to display the current durations for the tasks and milestones. You’ll also need to select the colours and the shape of the lines (top, middle or bottom). Typically I display the current task as the top, the baseline 0 below that, and then the original baseline below that.
- On the Gantt Chart, you can now see the current tasks in Blue, the original baseline in Red, and the current approved baseline in Green.
Good luck!
Ben.